Overview#
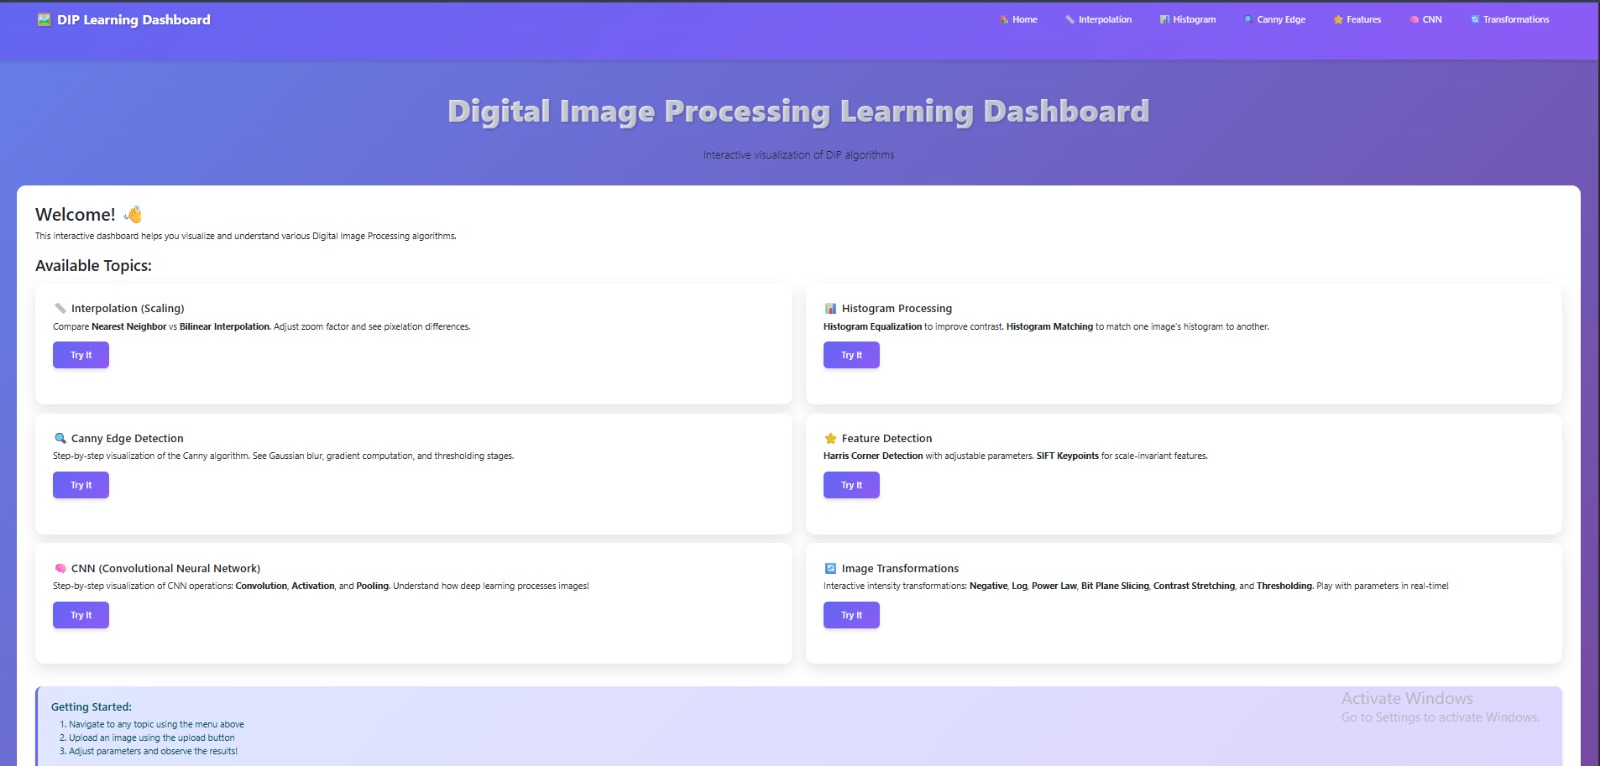
A web-based simulation tool designed to bridge the gap between theoretical equations and visual understanding in Computer Vision. Unlike standard image editors, this dashboard breaks down algorithms into their mathematical stages, offering a “glass-box” view of how pixels are manipulated.
Key Features#
Step-by-Step Simulation#
Visualizes the internal stages of algorithms (e.g., Canny Edge Detection: Gaussian Blur → Sobel Gradient → Hysteresis Thresholding).
Real-Time Parameter Tuning#
Interactive sliders to adjust Gaussian Sigma, Kernel sizes, and Threshold values with immediate visual feedback.
Advanced Processing#
Includes modules for:
- Histogram Equalization/Matching
- Morphological Operations (Erosion/Dilation)
- SIFT/Harris Feature Detection
Side-by-Side Comparison#
Split-screen view to compare original vs. processed imagery for pixel-perfect analysis.
Technologies Used#
- Language: Python
- UI Framework: Streamlit
- Core Libraries:
- OpenCV (Computer Vision)
- NumPy (Matrix Operations)
- Matplotlib (Data Visualization)